The Conversion Funnel Visualization in Google Analytics is a powerful tool for marketers to understand the customer journey, from first click to final conversion. By mapping out the steps users take, you can identify where they drop off and make data-driven decisions to optimize your marketing strategies and improve conversion rates.
The process starts with setting up goals in Google Analytics that represent your desired conversions, such as a purchase or a form submission. Next, you define the funnel steps—the specific pages or actions a user must take to reach that goal. For an e-commerce site, this might include viewing a product, adding it to the cart, and completing the checkout.
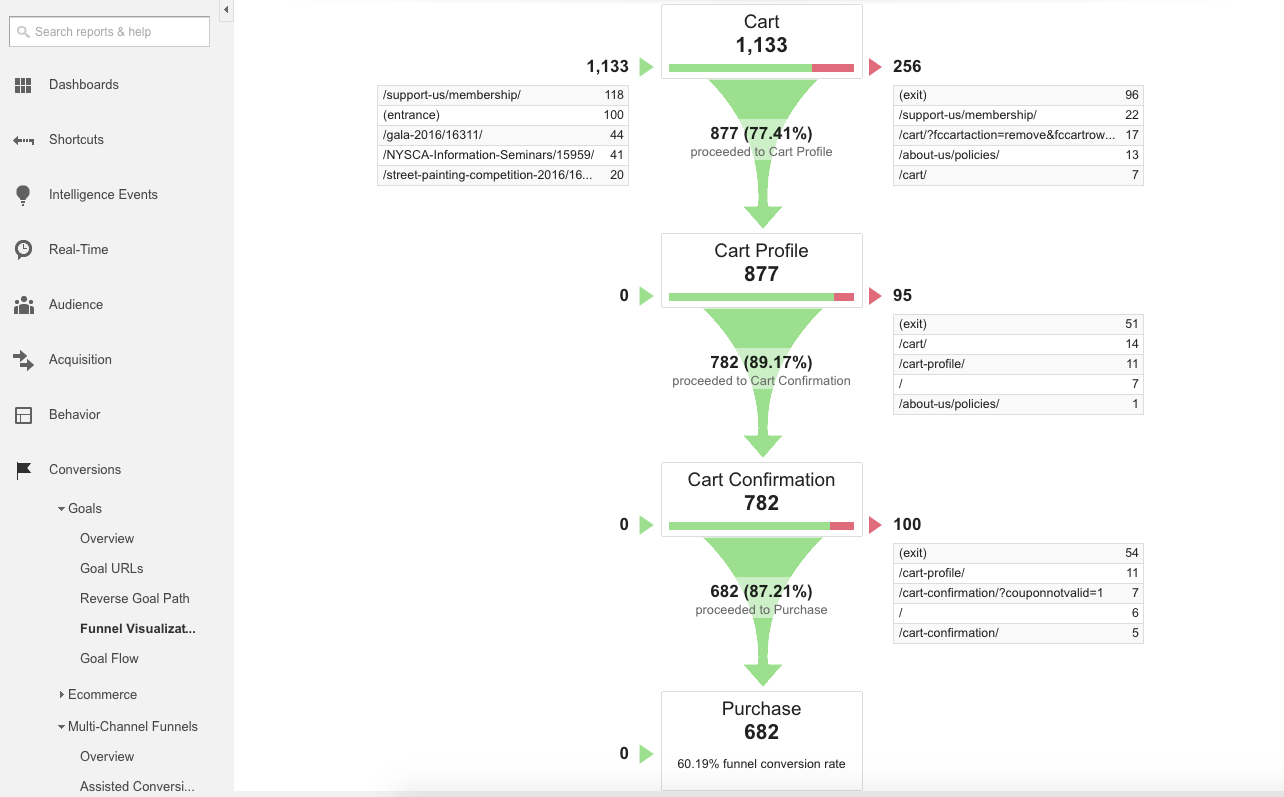
Once configured, the Funnel Visualization report shows you the percentage of users who move from one step to the next and where they exit the process. A high drop-off rate at a specific stage signals a potential issue, such as a confusing interface or technical problem. By analyzing this data, you can pinpoint bottlenecks and make targeted improvements to create a smoother, more effective user experience.
